

Introduction to Knowledge Graphs: Organizing Information for Smarter Systems
In our data-driven world, making sense of vast amounts of information is becoming more critical than ever. A knowledge graph is one of the most innovative tools used today to structure and connect data in a meaningful way. It's a powerful approach that helps machines understand relationships between pieces of information, making them more intelligent and capable of answering complex questions.
You might not realize it, but you’ve probably interacted with a knowledge graph before—every time you use a search engine or ask a virtual assistant like Siri or Alexa, you’re benefiting from this technology.
What is a Knowledge Graph?
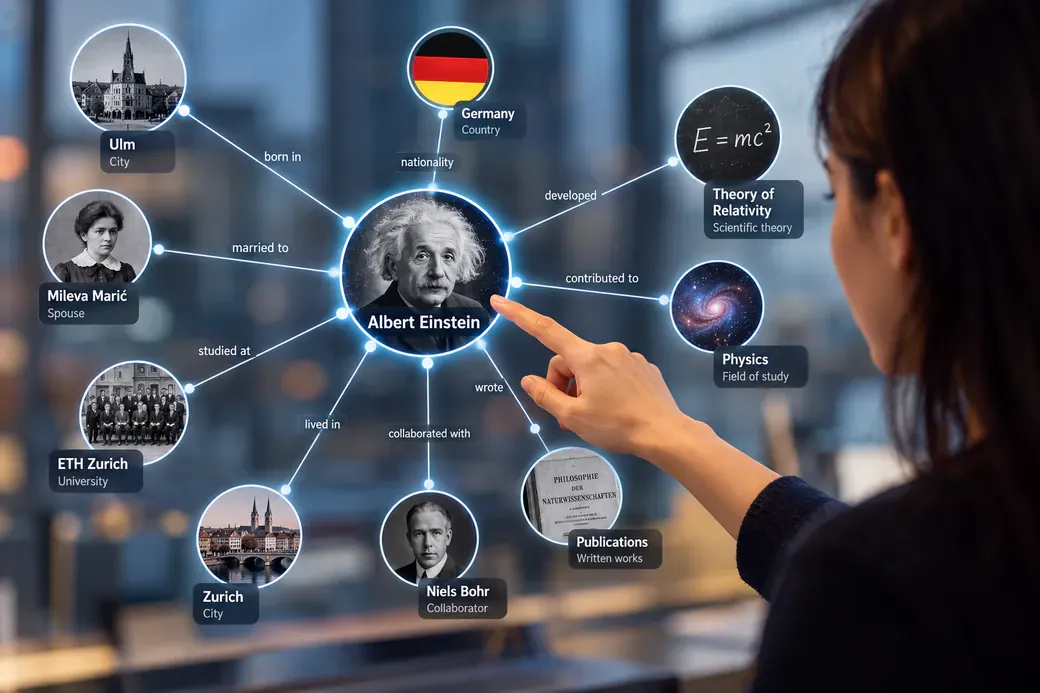
At its core, a knowledge graph is a network of information where each piece of data is represented as a node, and the connections between them are represented as edges or links. It’s a way to structure data so that machines can understand not just the individual pieces of information but also the relationships between them.
For example, in a knowledge graph about movies:
A node might represent a person, such as an actor, or an entity, like a movie.
An edge represents the relationship between these nodes. So, an actor might be connected to a movie node with a link that says "acted in."
These graphs are not just about listing facts but about linking them in a way that models real-world relationships.
Why Use Knowledge Graphs?
- Enhanced Search Results: Search engines like Google use knowledge graphs to give you more accurate and contextually relevant results. Instead of just matching keywords, the system understands the relationships between entities, so it can provide richer answers. If you search for “Leonardo DiCaprio movies,” the knowledge graph helps Google know that you’re talking about the actor and not someone else with a similar name, and pulls in related information.
- Contextual Understanding: Knowledge graphs allow systems to understand the context of the data. Instead of treating “Apple” just as a word, it knows the difference between "Apple" the fruit, "Apple" the company, and can even connect information about products, employees, or historical data related to the company.
- Improved Recommendations: By recognizing the relationships between data points, knowledge graphs can be used to make smarter recommendations. For example, streaming platforms like Netflix or Spotify can suggest new shows or songs by identifying the links between your preferences and other content.
- More Efficient Problem Solving: Businesses use knowledge graphs to organize large datasets, allowing systems to automatically discover connections, trends, or solutions that may not be obvious to human analysts.
Components of a Knowledge Graph
There are a few key components that make up a knowledge graph:
- Nodes: These represent entities or things (people, places, concepts, etc.). For example, “Paris,” “Eiffel Tower,” and “France” could all be nodes in a knowledge graph.
- Edges: These are the links or relationships between the nodes. In our example, “Paris” might be linked to “France” with the edge “capital of,” or “Eiffel Tower” could be linked to “Paris” as “located in.”
- Attributes: In addition to being connected to other nodes, each node can have attributes—properties or details about that node. For instance, the node “Eiffel Tower” might have attributes like its height, year of construction, and location.
- Ontology: This is the structure or schema that defines how the data in the graph is organized. It sets the rules for the types of entities and relationships that can exist in the graph, ensuring the data is connected in a meaningful way.
Real-World Applications of Knowledge Graphs
Knowledge graphs are not just theoretical concepts; they are widely used in many real-world applications:
- Search Engines: Google’s Knowledge Graph is perhaps the most famous example. It powers the information panels that appear when you search for things like famous people, places, or events. It helps provide direct answers to questions like “Who is the president of France?” or “What is the capital of Japan?”
- Healthcare: In the medical field, knowledge graphs are used to connect symptoms, treatments, drugs, and diseases. This can help doctors and researchers identify patterns, potential treatments, or new drug interactions that could improve patient care.
- E-Commerce: Platforms like Amazon use knowledge graphs to organize product information and improve search, allowing for better product recommendations based on customer behaviors and preferences.
- Social Media: Facebook uses a type of knowledge graph to understand relationships between people, interests, and activities. This helps with content recommendation and advertising targeting.
- Financial Services: In finance, knowledge graphs are employed to link financial entities, transactions, market trends, and regulatory information, helping institutions detect fraud, manage risks, and make data-driven decisions.
How Knowledge Graphs Help Machines “Think”
The beauty of a knowledge graph is that it makes data more semantic, meaning machines don’t just see raw data but can understand its meaning and context. Let’s say you ask a virtual assistant, “Who directed Titanic?” The knowledge graph not only knows that “Titanic” is a movie, but it also knows that “James Cameron” is linked to that movie as the director. This makes the system capable of responding in a more human-like way, giving you a direct answer instead of just a list of search results.
Challenges of Building Knowledge Graphs
While knowledge graphs are powerful, building and maintaining them comes with its own set of challenges:
- Data Integration: Knowledge graphs pull data from many different sources, which can be tricky when those sources don’t all follow the same structure or standards.
- Data Quality: For a knowledge graph to be useful, the data must be accurate and up-to-date. Incorrect or outdated information can lead to wrong conclusions.
- Scalability: As knowledge graphs grow, managing and querying large amounts of interconnected data efficiently can become a technical challenge.
- Ontology Design: Creating the right structure (ontology) to represent complex relationships can be difficult and requires deep domain knowledge.
Conclusion
Knowledge graphs are revolutionizing how machines interact with and understand data. By linking pieces of information in a way that mirrors the real world, they provide context and meaning, allowing for smarter searches, better recommendations, and more intuitive interactions with technology. Whether it’s powering search engines, helping businesses make decisions, or aiding in complex fields like healthcare, knowledge graphs are becoming a critical tool in organizing and utilizing vast amounts of data.